

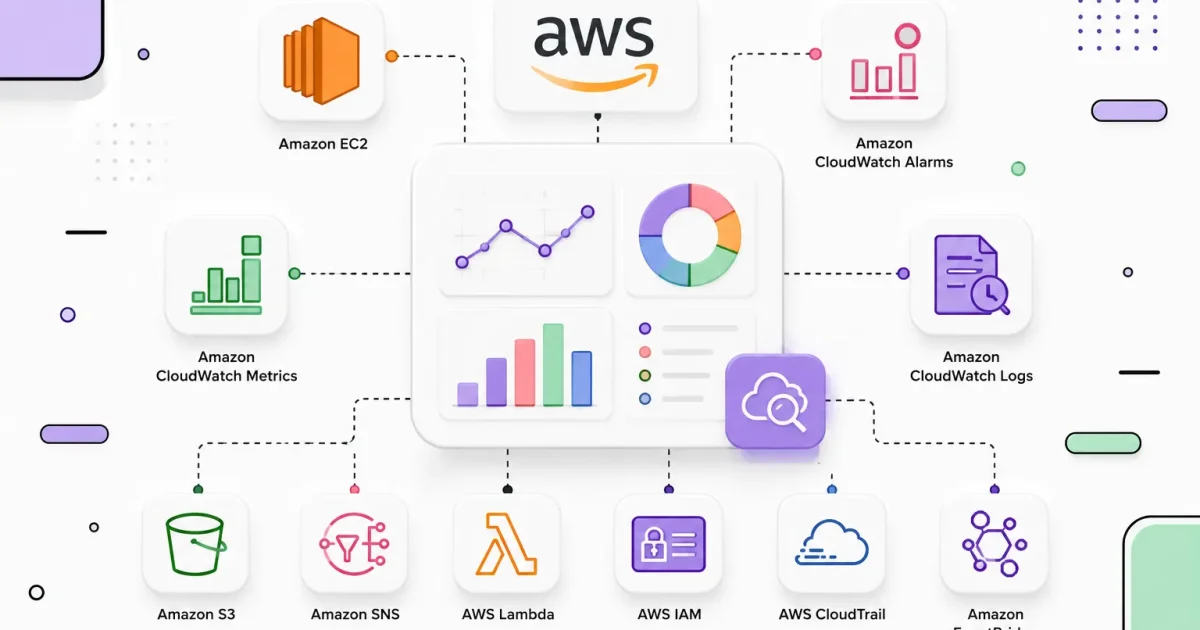
Learn how to monitor Amazon EC2 instances using AWS CloudWatch in this comprehensive step-by-step tutorial. You’ll install the CloudWatch Agent, collect CPU, memory, disk, and network metrics, create dashboards, configure alarms, send SNS email notifications, and analyze logs using a production-style monitoring setup.
Introduction
Monitoring is a critical part of managing applications in the cloud. Without proper visibility into your infrastructure, issues like high CPU usage, memory exhaustion, or disk space shortages can lead to poor performance and unexpected downtime.
Amazon CloudWatch is AWS’s native monitoring and observability service that helps you track metrics, collect logs, create dashboards, and configure alerts for your AWS resources and applications.
In this hands-on tutorial, you’ll learn how to monitor an Amazon EC2 instance by installing the CloudWatch Agent, collecting CPU, memory, disk, and network metrics, creating dashboards, setting up CloudWatch Alarms, and receiving email notifications through Amazon SNS. By the end, you’ll have a production-style monitoring setup that you can apply to real-world AWS environments.
Step 1: Launch an Amazon EC2 Instance
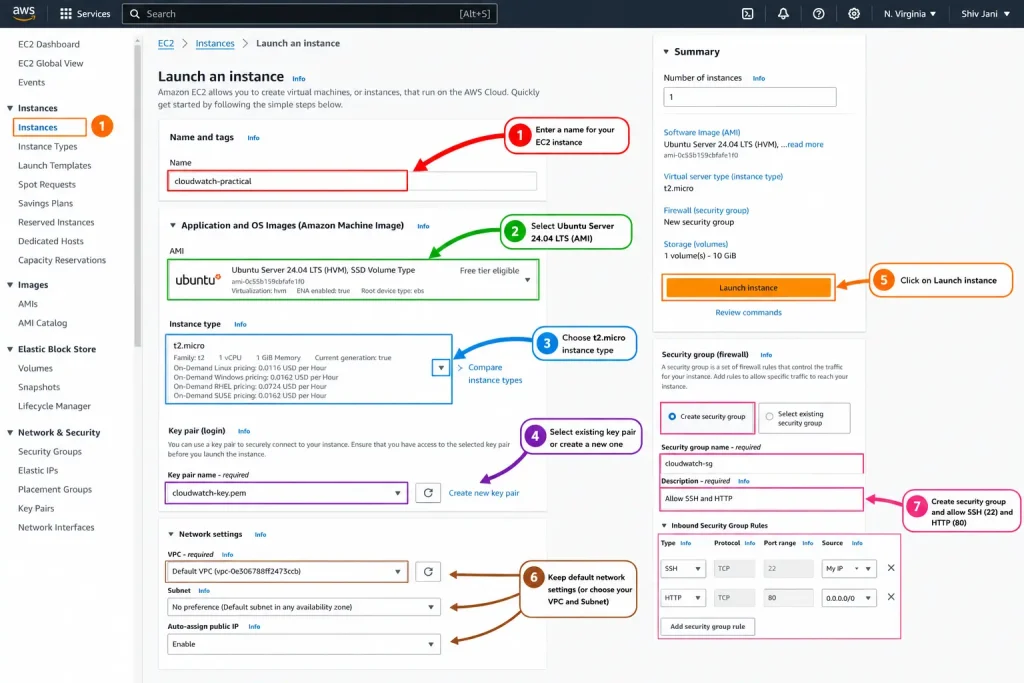
Before configuring Amazon CloudWatch, we need a server to monitor. In this tutorial, we’ll use an Ubuntu EC2 instance hosted on AWS. This instance will act as our web server, where we’ll later install Nginx, configure the CloudWatch Agent, collect system metrics, and monitor logs.
Log in to the AWS Management Console, navigate to the EC2 Dashboard, and click Launch Instance. Provide a name for your instance, select the Ubuntu Server 24.04 LTS Amazon Machine Image (AMI), choose the t2.micro instance type, create or select an existing key pair, and configure a security group that allows SSH (Port 22) and HTTP (Port 80). Leave the remaining settings as default and click Launch Instance.
Once the instance is created, wait until its status changes to Running. Also, make sure the Status Checks show 2/2 checks passed, indicating that the instance is healthy and ready for use.
Step 2: Connect to the EC2 Instance Using SSH
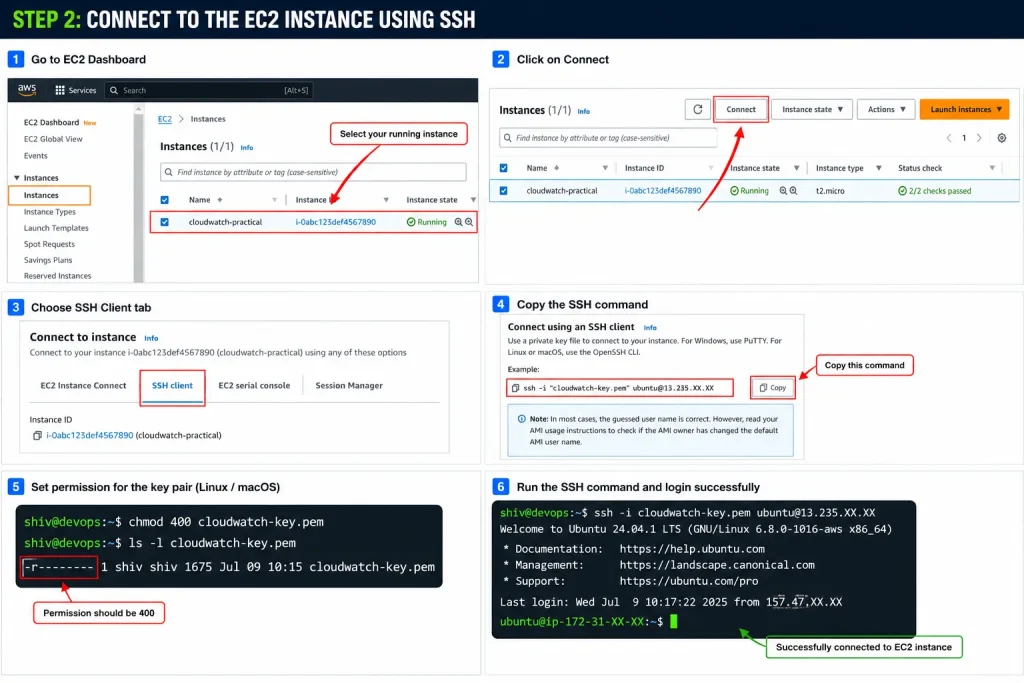
After launching your EC2 instance, the next step is to connect to it securely using SSH (Secure Shell). SSH provides encrypted remote access, allowing you to manage and configure your Linux server directly from your local machine.
Navigate to the EC2 Dashboard, select your running instance, and click Connect. Open the SSH Client tab to view the connection command generated by AWS. Before connecting, ensure your key pair file has the correct permissions (Linux/macOS users only), then run the SSH command in your terminal.
chmod 400 cloudwatch-key.pem

ssh -i cloudwatch-key.pem ubuntu@<EC2-Public-IP>
If the connection is successful, you’ll see the Ubuntu welcome message and the terminal prompt similar to:
ubuntu@ip-172-31-xx-xx:~$You are now connected to your EC2 instance and ready to install the required software for monitoring.
Step 3: Update the Ubuntu Server
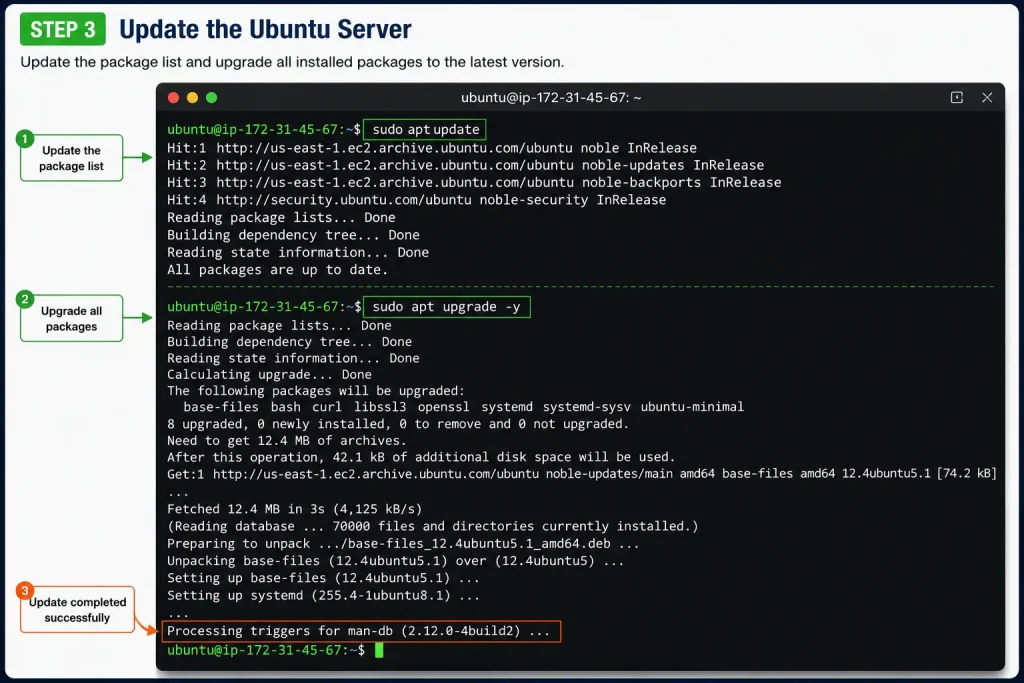
After successfully connecting to your EC2 instance, it’s a best practice to update the system packages before installing any software. This ensures your server has the latest security patches, bug fixes, and package versions, helping maintain a stable and secure environment.
Run the following commands in your terminal:
sudo apt update
sudo apt upgrade -y
The apt update command refreshes the package repository, while apt upgrade -y installs all available updates automatically without requiring confirmation.
Once the update process is complete, your Ubuntu server is ready for the installation of Nginx and the Amazon CloudWatch Agent in the following steps.
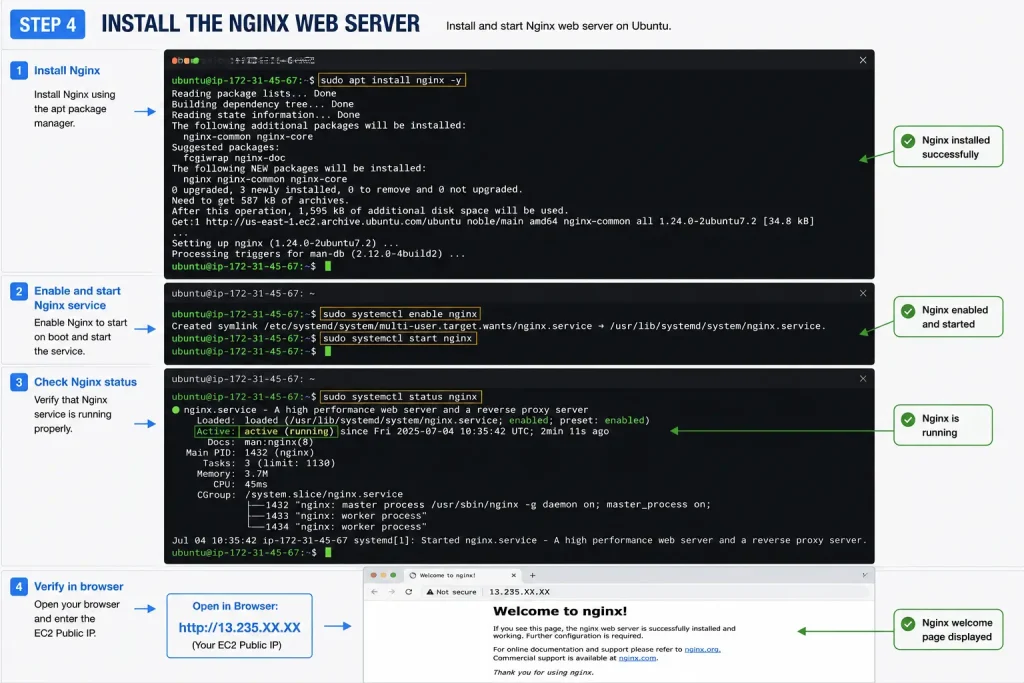
Step 4: Install the Nginx Web Server
With your Ubuntu server updated, the next step is to install Nginx, a lightweight and high-performance web server. We’ll use Nginx to generate web traffic later in this tutorial and monitor its performance using Amazon CloudWatch.
Run the following command to install Nginx:
sudo apt install nginx -yAfter the installation is complete, enable the Nginx service so it starts automatically whenever the server boots, and then start the service.
sudo systemctl enable nginx
sudo systemctl start nginx
Verify that the service is running successfully by checking its status:
sudo systemctl status nginxIf the service is active, open your browser and visit:
http://<EC2-Public-IP>You should see the “Welcome to nginx!” page, confirming that the web server has been installed and is accessible over the internet.
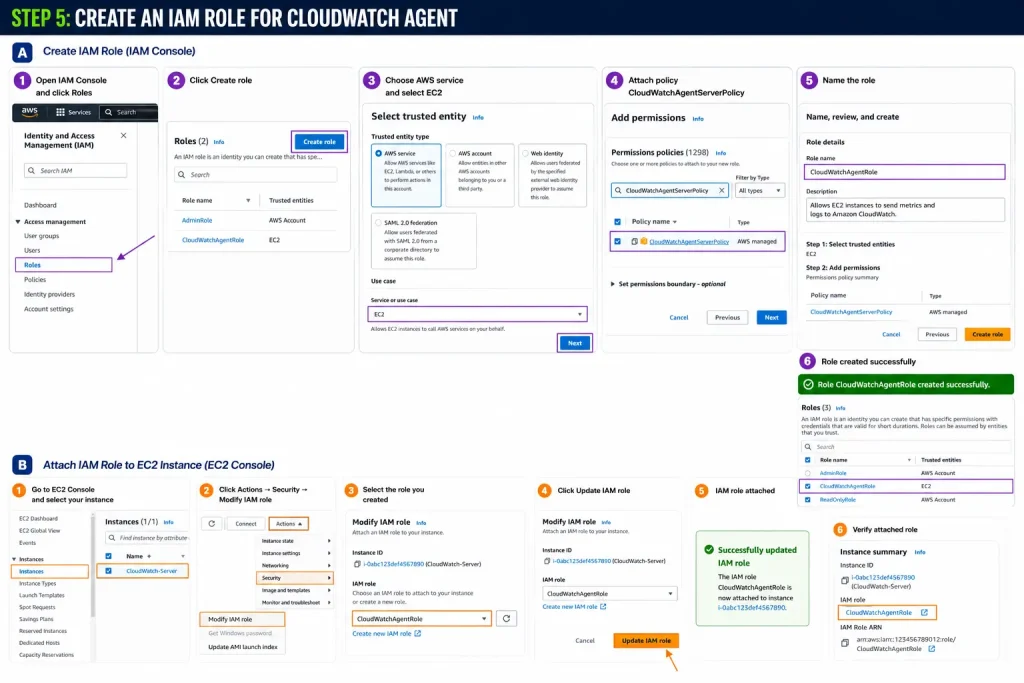
Step 5: Create an IAM Role for CloudWatch Agent
Before installing the Amazon CloudWatch Agent, your EC2 instance needs permission to send metrics and logs to Amazon CloudWatch. Instead of storing access keys on the server, AWS recommends attaching an IAM Role to the EC2 instance. This is the most secure and production-ready approach.
Navigate to the AWS Management Console and open the IAM service. Click Roles → Create Role, choose AWS Service as the trusted entity, and select EC2 as the use case. On the permissions page, search for and attach the CloudWatchAgentServerPolicy managed policy. Give the role a name such as CloudWatchAgentRole, review the configuration, and create the role.
After the role is created, go to EC2 → Instances, select your running instance, click Actions → Security → Modify IAM Role, choose the newly created CloudWatchAgentRole, and click Update IAM Role.
Once the IAM role is attached, your EC2 instance will have the necessary permissions to publish metrics and logs to Amazon CloudWatch without requiring any AWS access keys.
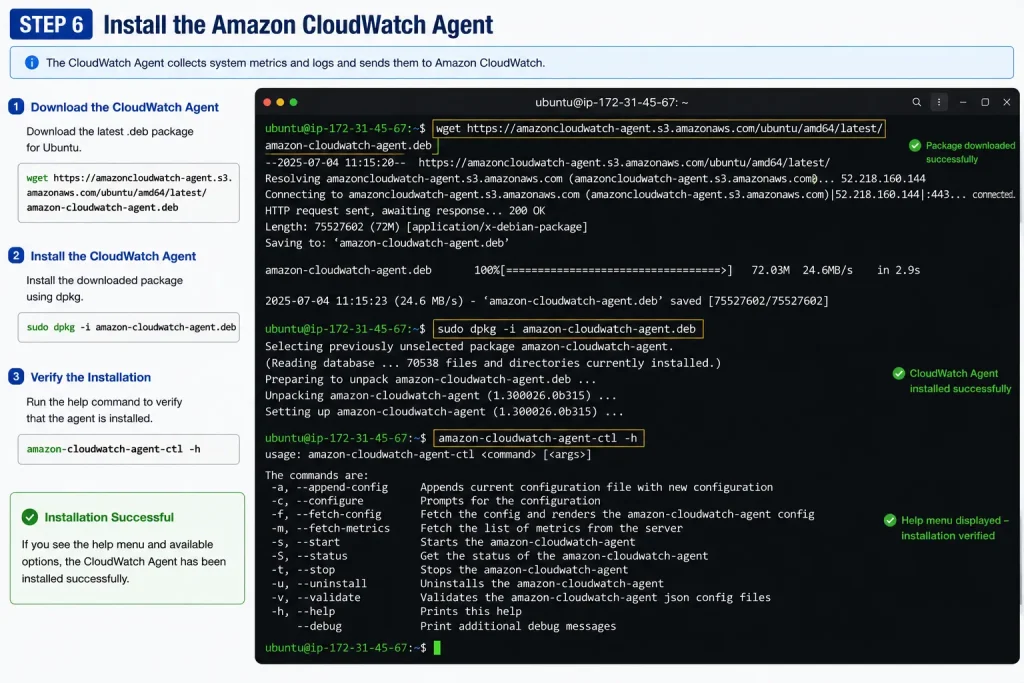
Step 6: Install the Amazon CloudWatch Agent
Now that the required IAM role has been attached to the EC2 instance, the next step is to install the Amazon CloudWatch Agent. This agent collects additional system metrics such as memory usage, disk utilization, and system logs, which are not available in Amazon EC2’s default monitoring.
Download the latest CloudWatch Agent package for Ubuntu and install it using the following commands:
wget https://amazoncloudwatch-agent.s3.amazonaws.com/ubuntu/amd64/latest/amazon-cloudwatch-agent.deb

sudo dpkg -i amazon-cloudwatch-agent.deb
After the installation is complete, verify that the CloudWatch Agent has been installed successfully by running:
amazon-cloudwatch-agent-ctl -hIf the installation is successful, the command will display the CloudWatch Agent help menu and available options. Your EC2 instance is now ready to configure the CloudWatch Agent in the next step.
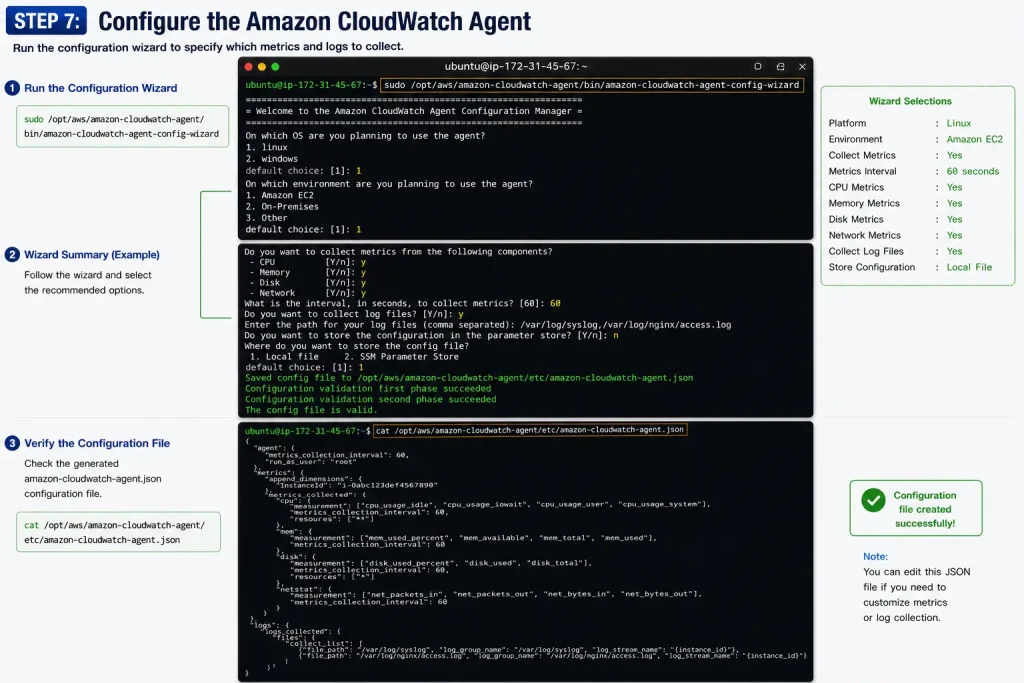
Step 7: Configure the Amazon CloudWatch Agent
After installing the CloudWatch Agent, the next step is to configure it so that it knows which metrics and logs to collect from your EC2 instance. AWS provides an interactive configuration wizard that generates the required configuration file automatically.
Run the following command to start the configuration wizard:
sudo /opt/aws/amazon-cloudwatch-agent/bin/amazon-cloudwatch-agent-config-wizardDuring the wizard, choose the following recommended options:
| Configuration | Value |
|---|---|
| Platform | Linux |
| Environment | Amazon EC2 |
| Collect Metrics | Yes |
| Metrics Collection Interval | 60 seconds |
| Collect CPU Metrics | Yes |
| Collect Memory Metrics | Yes |
| Collect Disk Metrics | Yes |
| Collect Network Metrics | Yes |
| Collect Log Files | Yes |
| Store Configuration | Local File |
After completing the wizard, the CloudWatch Agent configuration file will be created automatically at:
/opt/aws/amazon-cloudwatch-agent/etc/amazon-cloudwatch-agent.jsonYou can verify the configuration file by running:
cat /opt/aws/amazon-cloudwatch-agent/etc/amazon-cloudwatch-agent.jsonIf the JSON configuration is displayed successfully, the CloudWatch Agent is now configured and ready to start collecting metrics and logs.
Step 8: Start the Amazon CloudWatch Agent
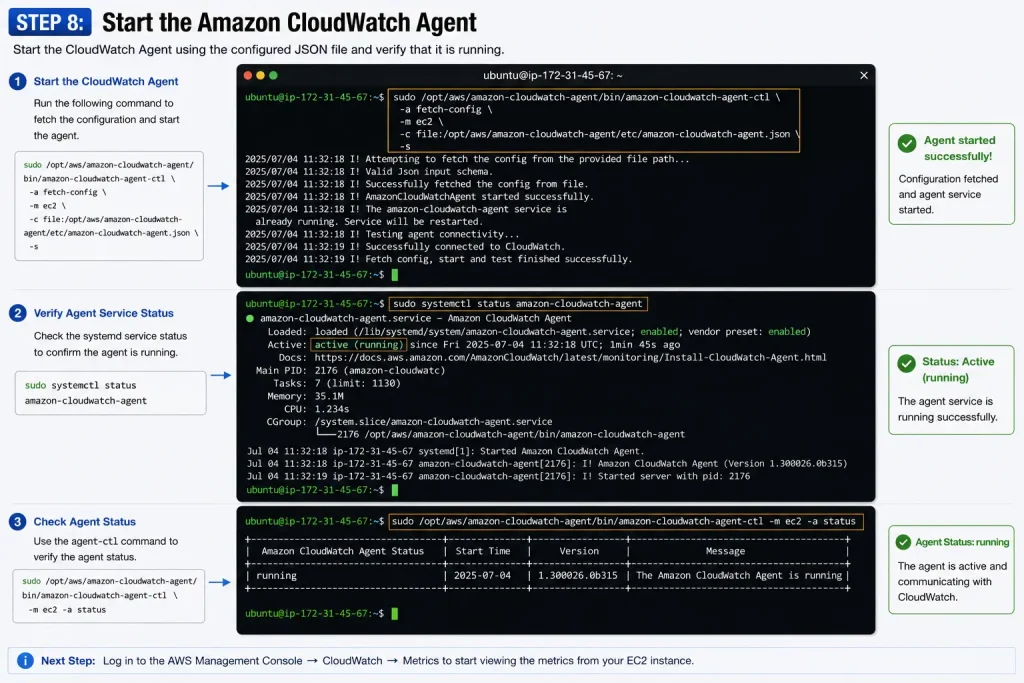
After configuring the CloudWatch Agent, the final step is to start the service so it can begin collecting system metrics and log data from your EC2 instance. The agent reads the generated configuration file and starts sending the selected metrics to Amazon CloudWatch.
Run the following command to fetch the configuration file and start the CloudWatch Agent:
sudo /opt/aws/amazon-cloudwatch-agent/bin/amazon-cloudwatch-agent-ctl \
-a fetch-config \
-m ec2 \
-c file:/opt/aws/amazon-cloudwatch-agent/etc/amazon-cloudwatch-agent.json \
-s
Once the command executes successfully, verify that the agent is running by checking its service status:
sudo systemctl status amazon-cloudwatch-agentYou should see the status Active (running). This confirms that the CloudWatch Agent is successfully running and has started publishing metrics and logs to Amazon CloudWatch.
You can also verify the agent status using:
sudo /opt/aws/amazon-cloudwatch-agent/bin/amazon-cloudwatch-agent-ctl -m ec2 -a statusThe output should display status: running, indicating that the agent is active and communicating with Amazon CloudWatch.
Step 9: Verify Metrics in Amazon CloudWatch
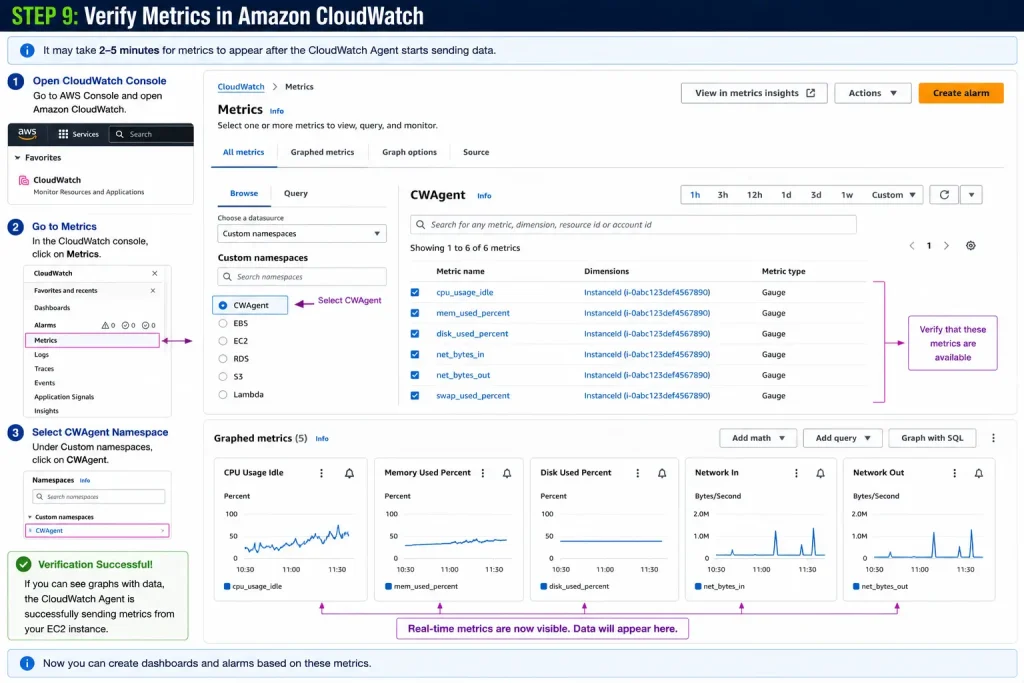
With the CloudWatch Agent running successfully, it’s time to verify that your EC2 instance is sending metrics to Amazon CloudWatch. The agent begins publishing system metrics such as CPU utilization, memory usage, disk utilization, and network statistics, which can now be viewed from the AWS Management Console.
Navigate to the Amazon CloudWatch service and open Metrics. Under the Custom Namespaces section, select CWAgent. Here you’ll find all the metrics collected by the CloudWatch Agent for your EC2 instance.
Open the CWAgent namespace and verify that the following metrics are available:
- CPU Utilization
- Memory Used Percentage (
mem_used_percent) - Disk Used Percentage (
disk_used_percent) - Network In
- Network Out
Click on any metric to view its real-time graph. If this is your first time configuring the agent, it may take 2–5 minutes for the metrics to appear.
Once the graphs start displaying data, it confirms that the CloudWatch Agent is successfully sending metrics from your EC2 instance to Amazon CloudWatch.
Step 10: Create a CloudWatch Dashboard
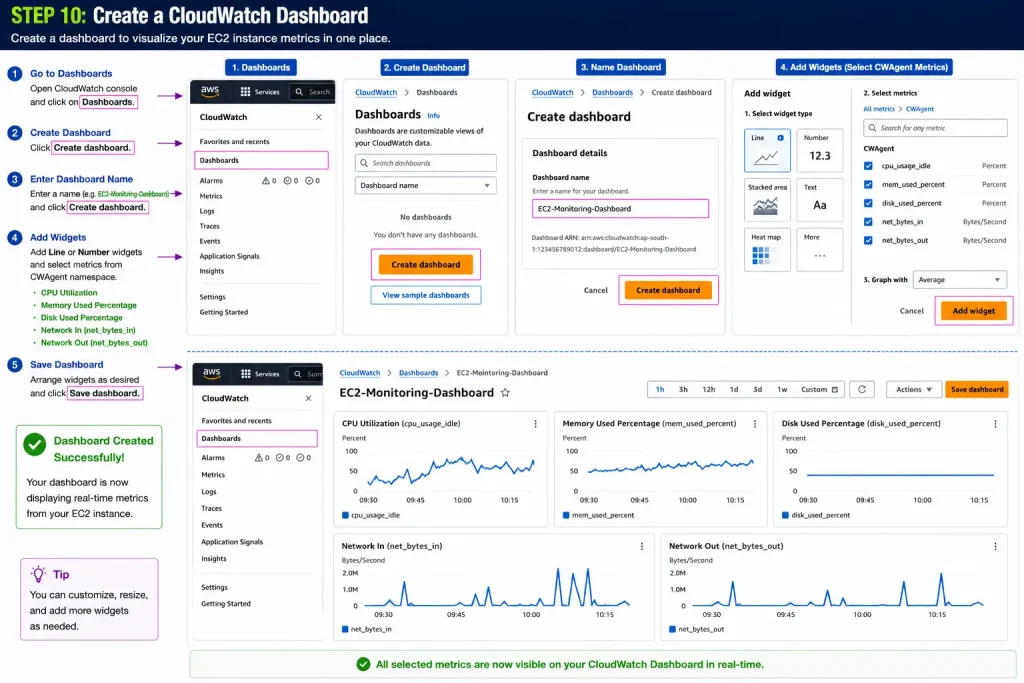
Now that your EC2 instance is publishing metrics to Amazon CloudWatch, the next step is to create a CloudWatch Dashboard. A dashboard provides a centralized view of your infrastructure by displaying multiple metrics on a single screen, making it easier to monitor your server’s health in real time.
Navigate to Amazon CloudWatch in the AWS Management Console, select Dashboards from the left navigation pane, and click Create dashboard. Enter a dashboard name, such as EC2-Monitoring-Dashboard, and click Create dashboard.
Next, add Line or Number widgets and select the following metrics from the CWAgent namespace:
- CPU Utilization
- Memory Used Percentage (
mem_used_percent) - Disk Used Percentage (
disk_used_percent) - Network In (
net_bytes_in) - Network Out (
net_bytes_out)
Arrange the widgets as desired and click Save dashboard.
Once saved, your dashboard will display real-time graphs for all selected metrics, giving you a single place to monitor the performance and health of your EC2 instance.
Conclusion
Congratulations! You have successfully completed this AWS CloudWatch Tutorial and built a complete monitoring solution for an Amazon EC2 instance from scratch.
In this hands-on practical guide, you learned how to launch an EC2 instance, connect securely using SSH, install Nginx, configure an IAM Role, install and configure the Amazon CloudWatch Agent, collect custom system metrics, and build a real-time CloudWatch Dashboard to monitor your infrastructure.
Unlike the default EC2 monitoring, the CloudWatch Agent enables you to collect advanced operating system metrics such as memory utilization, disk usage, and network statistics, providing deeper visibility into your server’s health and performance.
Monitoring is one of the most important pillars of DevOps, Cloud Computing, and Site Reliability Engineering (SRE). A properly configured monitoring solution helps teams detect performance issues early, reduce downtime, improve application reliability, and make data-driven operational decisions.
Whether you’re preparing for AWS certification, building your DevOps portfolio, or managing production workloads, mastering Amazon CloudWatch is an essential skill for every cloud engineer.
What We Accomplished
Throughout this tutorial, we completed the following tasks:
- Launched an Ubuntu EC2 instance
- Connected to the server using SSH
- Updated the operating system packages
- Installed and configured the Nginx web server
- Created an IAM Role with CloudWatch permissions
- Installed the Amazon CloudWatch Agent
- Configured the CloudWatch Agent to collect system metrics
- Started and verified the CloudWatch Agent
- Confirmed metrics in the CWAgent namespace
- Created a custom CloudWatch Dashboard for real-time monitoring
Key Learnings
After completing this practical, you should understand how to:
- Monitor EC2 instances using Amazon CloudWatch
- Collect custom metrics like memory and disk usage
- Use the CloudWatch Agent for advanced monitoring
- Build custom monitoring dashboards
- Analyze infrastructure performance using CloudWatch Metrics
- Apply monitoring best practices in AWS environments
Best Practices
Follow these recommendations when using CloudWatch in production:
- Use IAM Roles instead of AWS access keys.
- Enable detailed monitoring for production EC2 instances when required.
- Organize dashboards by application or environment (Development, Staging, Production).
- Configure CloudWatch Alarms for critical metrics such as CPU, memory, disk, and status checks.
- Set appropriate log retention policies to manage storage costs.
- Tag AWS resources consistently for easier monitoring and reporting.
- Regularly review dashboards and alarms to ensure they remain relevant as workloads evolve.
Next Steps
Now that you’ve built a monitoring dashboard, consider extending your setup with the following AWS services:
- Amazon SNS – Send email notifications when alarms are triggered.
- CloudWatch Alarms – Automatically detect high CPU, memory, or disk usage.
- CloudWatch Logs – Centralize and analyze application and system logs.
- Application Load Balancer (ALB) – Monitor traffic, latency, and HTTP errors.
- Auto Scaling – Automatically add or remove EC2 instances based on CloudWatch metrics.
- AWS X-Ray – Trace and troubleshoot distributed applications.
- Amazon Managed Service for Prometheus & Amazon Managed Grafana – Build advanced observability dashboards.
- AWS Systems Manager – Automate operational tasks and improve server management.
Common Troubleshooting
| Issue | Possible Cause | Solution |
|---|---|---|
| Metrics are not visible | CloudWatch Agent not running | Verify the agent service and restart it if necessary. |
| Memory or Disk metrics missing | Agent configuration incomplete | Reconfigure the CloudWatch Agent to collect these metrics. |
| Dashboard shows no data | Metrics not yet available | Wait 2–5 minutes and refresh the dashboard. |
| Permission errors | IAM Role not attached | Attach the CloudWatchAgentServerPolicy to the EC2 instance. |
| Agent fails to start | Invalid JSON configuration | Validate and correct the configuration file before restarting the agent. |
Resources
- AWS Documentation: https://docs.aws.amazon.com/AmazonCloudWatch/latest/monitoring/
- CloudWatch Agent Documentation: https://docs.aws.amazon.com/AmazonCloudWatch/latest/monitoring/Install-CloudWatch-Agent.html
- Amazon EC2 Documentation: https://docs.aws.amazon.com/ec2/
- AWS IAM Documentation: https://docs.aws.amazon.com/iam/
Final Thoughts
Amazon CloudWatch is much more than a metrics dashboard—it is the foundation of monitoring and observability in AWS. As your applications grow, you’ll rely on CloudWatch to detect issues early, automate responses, and maintain the reliability of your infrastructure.
The practical you’ve completed today is the same starting point used in many production AWS environments. From here, you can continue building advanced monitoring solutions by integrating alarms, notifications, log analytics, Auto Scaling, and observability tools.
Keep experimenting, monitor your infrastructure proactively, and continue building production-ready cloud skills.