
Learn how a CI/CD pipeline failure caused a production outage, how the engineering team identified the root cause, restored service, and implemented DevOps best practices to prevent future incidents.
Introduction
Modern software companies deploy code dozens or even hundreds of times every day. Continuous Integration and Continuous Deployment (CI/CD) pipelines have transformed software delivery by automating testing, building, security scanning, and deployments. When implemented correctly, these pipelines enable engineering teams to release new features faster, improve software quality, and reduce manual errors.
However, automation introduces a new challenge: if a faulty change passes through the pipeline, it can reach production within minutes. Without proper safeguards, a single configuration mistake, an incorrect environment variable, or a failed database migration can impact thousands—or even millions—of users before engineers have time to react.
This case study examines a realistic DevOps incident in which a CI/CD pipeline successfully completed, but a hidden configuration issue caused a production outage immediately after deployment. While the tools worked exactly as designed, the deployment introduced a change that prevented the application from starting correctly in production.
The incident demonstrates that successful DevOps is not only about automating deployments—it is also about building resilient delivery pipelines with validation, observability, rollback strategies, and operational safeguards. Throughout this article, we will analyze the complete lifecycle of the incident, from deployment to recovery, identify the root cause, and explore the engineering improvements that prevented similar failures in the future.
Company Background
Imagine a Software-as-a-Service (SaaS) company called CloudCart, an online commerce platform serving more than 2,500 business customers worldwide. Every day, the platform processes thousands of customer transactions, payment requests, inventory updates, and API calls.
To support continuous product development, the engineering team adopted a cloud-native architecture running on Kubernetes. The infrastructure was designed to enable multiple deployments every day without affecting customer availability.
The technology stack included:
GitHub for source code management
GitHub Actions for CI/CD automation
Docker for containerization
Kubernetes for orchestration
NGINX Ingress Controller
PostgreSQL as the primary database
Redis for caching
Prometheus and Grafana for monitoring
Loki for centralized logging
OpenTelemetry for distributed tracing
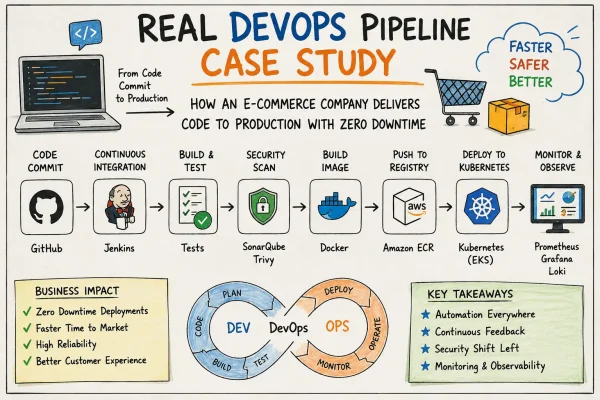
Every code change followed a standardized delivery pipeline. Developers created feature branches, opened pull requests, completed peer reviews, and merged approved code into the main branch. A GitHub Actions workflow automatically built the Docker image, executed automated tests, scanned the image for vulnerabilities, published it to the container registry, and deployed the latest version to the Kubernetes production cluster.
This automated workflow significantly reduced deployment time, allowing new features and bug fixes to reach customers within minutes.
Existing CI/CD Pipeline
The deployment workflow was fully automated and followed a predictable sequence.
Pipeline Flow
Developer Commit -> Pull Request -> Code Review -> Automated Unit Tests -> Integration Tests -> Docker Image Build -> Security Scan -> Push Image to Container Registry -> Deploy to Kubernetes -> Smoke Tests -> Production Release
On paper, the pipeline appeared mature. Every deployment passed through multiple quality gates before reaching production.
Unfortunately, one critical validation step was missing.
The Incident
On a Monday morning, the development team completed work on a new feature that introduced enhanced payment processing. The code changes were relatively small, affecting only a few application components. All automated tests passed successfully, and the pull request was reviewed and approved.
At 09:10 AM, the changes were merged into the main branch.
The CI/CD pipeline immediately started executing.
Within six minutes, the Docker image had been built successfully, scanned for vulnerabilities, and pushed to the organization’s container registry. Kubernetes began performing a rolling deployment, gradually replacing older application Pods with the newly deployed version.
Initially, everything appeared healthy. The deployment completed without errors, and Kubernetes reported that all Pods had started successfully.
Approximately two minutes later, the monitoring platform began reporting an increasing number of HTTP 500 responses. Customer support simultaneously started receiving complaints that users were unable to complete purchases or access their dashboards.
Within minutes, application availability had dropped dramatically.
Immediate Impact
Although the deployment itself completed successfully, the application failed after startup.
Users experienced:
HTTP 500 Internal Server Errors
Failed payment transactions
Login failures
Increased application latency
Intermittent API timeouts
Business operations were immediately affected.
Within the first fifteen minutes of the outage:
Thousands of customer requests failed.
Active shopping carts could not complete checkout.
Customer support tickets increased significantly.
Monitoring dashboards reported error rates exceeding service-level objectives (SLOs).
Revenue-generating transactions were interrupted.
The deployment pipeline had done exactly what it was designed to do—deliver the latest version automatically. The problem was that the pipeline lacked safeguards capable of detecting configuration errors that only appeared in the production environment.
Incident Detection
Fortunately, the engineering team had invested in a comprehensive observability platform.
Prometheus detected a sudden increase in application error rates. Grafana dashboards displayed rapidly rising latency and request failures, while Alertmanager immediately notified the on-call DevOps engineer through Slack and PagerDuty.
At the same time, centralized application logs collected by Loki showed repeated application startup failures across multiple Pods.
Distributed traces generated through OpenTelemetry confirmed that requests consistently failed during the application’s initialization phase before reaching downstream services.
Because monitoring and alerting were already in place, the engineering team became aware of the incident within minutes instead of relying solely on customer reports.
This rapid detection significantly reduced the overall duration of the outage and enabled engineers to begin troubleshooting immediately.
Root Cause Analysis
Once the incident was declared, the DevOps and Site Reliability Engineering (SRE) teams immediately initiated the organization’s incident response process. Their first priority was to identify whether the issue originated from the infrastructure, the Kubernetes cluster, the application itself, or the latest deployment.
Using Kubernetes dashboards and command-line tools, the engineers began investigating the health of the production workloads.
The first observation was unexpected. Although the deployment had completed successfully, several application Pods were continuously restarting. Instead of remaining in a healthy running state, the Pods entered a CrashLoopBackOff condition shortly after startup.
This indicated that Kubernetes itself was functioning correctly. The cluster was successfully scheduling Pods, creating containers, and routing traffic. The failure occurred after the application process started, suggesting that the problem existed inside the application or its runtime configuration rather than within the Kubernetes infrastructure.
The engineering team executed several diagnostic commands to gather more information.
kubectl get pods

kubectl describe pod payment-service-7d8d4f8c69

kubectl logs payment-service-7d8d4f8c69

kubectl rollout history deployment/payment-service
The logs immediately revealed the underlying issue.
During application startup, the payment service attempted to load a required environment variable named DATABASE_CONNECTION_URL. However, the variable was missing because the Kubernetes Secret referenced in the Deployment manifest had not been updated during the latest release.
Without the required database connection string, the application failed to initialize and terminated itself. Kubernetes automatically restarted the container, but each restart produced the same error, resulting in an endless restart loop.
The CI/CD pipeline had successfully built the Docker image, executed unit tests, and deployed the application to production. However, it never validated whether all required Kubernetes Secrets and ConfigMaps were available in the target environment before beginning the rollout.
This small configuration oversight triggered a production outage despite the pipeline reporting a successful deployment.
Understanding Why the Pipeline Didn’t Catch the Issue
At first glance, many team members questioned how such a critical error had passed through every stage of the CI/CD pipeline.
A detailed review revealed that the pipeline validated the application code but did not fully validate the production environment.
The automated workflow included:
-
Source code compilation
-
Unit testing
-
Static code analysis
-
Docker image creation
-
Vulnerability scanning
-
Image publishing
-
Kubernetes deployment
What it did not include was environment validation.
The deployment process assumed that all required Secrets, ConfigMaps, and external dependencies already existed inside the Kubernetes cluster.
Because the missing Secret was only required in the production namespace, none of the earlier pipeline stages detected the problem.
This incident highlighted an important lesson in DevOps:
A successful pipeline execution does not necessarily mean a successful production deployment.
Production readiness depends not only on application code but also on infrastructure configuration, secrets management, external services, networking, and runtime dependencies.
Incident Timeline
Understanding the sequence of events helped the team identify opportunities for improving both the deployment process and incident response.
| Time | Event |
|---|---|
| 09:10 AM | Developer merged the Pull Request into the main branch. |
| 09:11 AM | GitHub Actions pipeline started automatically. |
| 09:14 AM | Docker image successfully built and scanned. |
| 09:16 AM | Image pushed to the container registry. |
| 09:17 AM | Kubernetes rolling deployment began. |
| 09:18 AM | New Pods entered CrashLoopBackOff. |
| 09:19 AM | Error rate exceeded alert threshold. |
| 09:20 AM | Prometheus triggered alerts. |
| 09:21 AM | PagerDuty notified the on-call DevOps engineer. |
| 09:23 AM | Incident bridge created. |
| 09:28 AM | Root cause identified. |
| 09:31 AM | Deployment rollback initiated. |
| 09:35 AM | Previous stable version restored. |
| 09:38 AM | Error rate returned to normal. |
| 09:45 AM | Incident officially resolved. |
The Recovery Process
After confirming that the latest deployment was responsible for the outage, the engineering team decided that restoring service quickly was more important than attempting an immediate fix in production.
Rather than modifying the running deployment, they initiated a rollback to the previous stable release.
Kubernetes made this process straightforward.
Using the rollout history, engineers identified the last known healthy deployment revision and executed the rollback command.
kubectl rollout undo deployment/payment-service
Within a few minutes, Kubernetes gradually replaced the failing Pods with containers running the previous application version.
As healthy Pods became available, traffic automatically shifted back to the stable release.
Prometheus dashboards immediately showed:
-
HTTP 500 errors decreasing
-
Pod restart counts returning to zero
-
Response times stabilizing
-
CPU utilization returning to normal
-
Successful health checks across all replicas
The rollback restored customer access without requiring manual intervention on individual servers.
This demonstrated one of Kubernetes’ greatest strengths: fast, controlled recovery through declarative deployments and automated orchestration.
Lessons Learned
Following the incident, the engineering team conducted a formal Post-Incident Review (PIR) to identify not only what failed, but why the existing processes allowed the failure to reach production.
Several important improvements were identified.
First, the CI/CD pipeline was enhanced to validate Kubernetes Secrets and ConfigMaps before deployment.
Second, deployment verification steps were added to confirm that every required dependency existed before any Pods were updated.
Third, automated smoke tests were expanded to verify application startup and database connectivity immediately after deployment.
Finally, the organization adopted progressive deployment strategies, including Canary Releases and Blue-Green Deployments, allowing new versions to receive only a small percentage of production traffic before full rollout.
These improvements significantly reduced deployment risk and strengthened the organization’s overall DevOps maturity.
The incident reinforced a valuable engineering principle:
Automation alone does not guarantee reliability. True DevOps success comes from combining automation with validation, observability, resilience, and continuous learning.